Understanding Manchester United’s Position in the xG Table
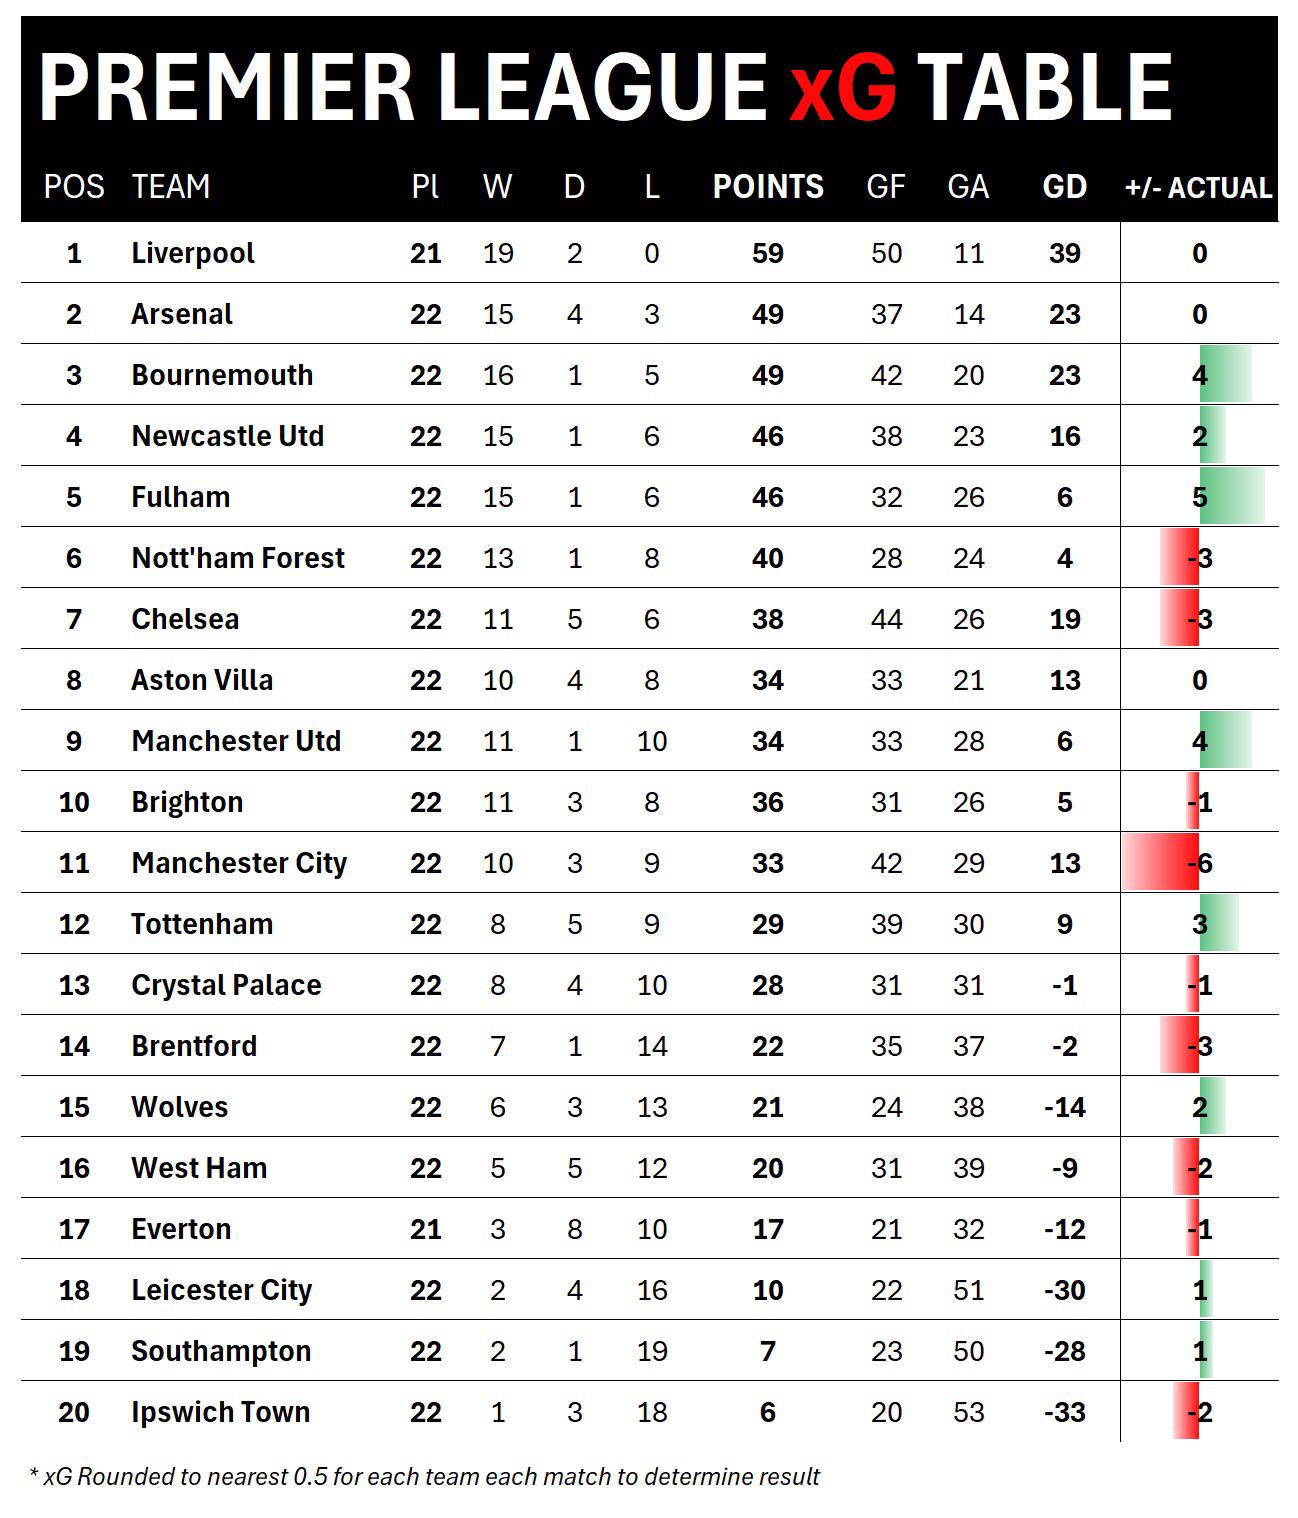
The latest Premier League expected goals (xG) table provides fascinating insights into Manchester United’s current campaign. Sitting in 9th position with 34 points from 22 matches, the Red Devils have recorded 11 wins, 1 draw, and 10 losses, with a goal difference of +6.
Breaking Down the Numbers
* Points: 34 from 22 games
* Goals Scored: 33
* Goals Conceded: 28
* Goal Difference: +6
* xG Performance: +4 (positive variance)
Comparative Analysis
The xG table shows United performing slightly above expectations with a +4 variance, suggesting the team has been relatively efficient in converting chances. However, the positioning below traditional rivals like Arsenal (2nd) and Liverpool (1st) indicates significant room for improvement.
Key Observations
* Liverpool leads the table with 59 points and an impressive +39 goal difference
* United’s 33 goals scored suggests a need for increased attacking efficiency
* The team’s defensive record (28 goals conceded) sits mid-table in terms of performance
Looking Forward
For Manchester United to climb the table, focus needs to be placed on:
1. Improving chance creation
2. Maintaining defensive stability
3. Converting more opportunities in front of goal
Room for Improvement
With teams like Bournemouth and Newcastle United performing above expectations, United must find consistency to challenge for European positions. The positive xG variance (+4) suggests the team is slightly overperforming relative to chances created, indicating a need for improved chance creation.
Conclusion
While the current position might not meet fans’ expectations, the xG data provides hope for improvement. The challenge now lies in translating this statistical efficiency into more consistent results on the pitch.
[Internal Link: Read more about United’s tactical evolution this season here]
#MUFC #PremierLeague #FootballAnalytics

